
Since we know now how to use the pipeline to process basic data, it is now time to step it up a notch.
In this example, we are going to generate multichannel waveforms using the SignalGenerator class of the Datapipeline API
We are also going to use the MCsweep object from Jan's RZ2ephys.py -- an absolutely essential component for working with the TDT RZ2 system. And to make it even more interesting, we attach some metadata to the Dataframe.
The SignalGenerator class
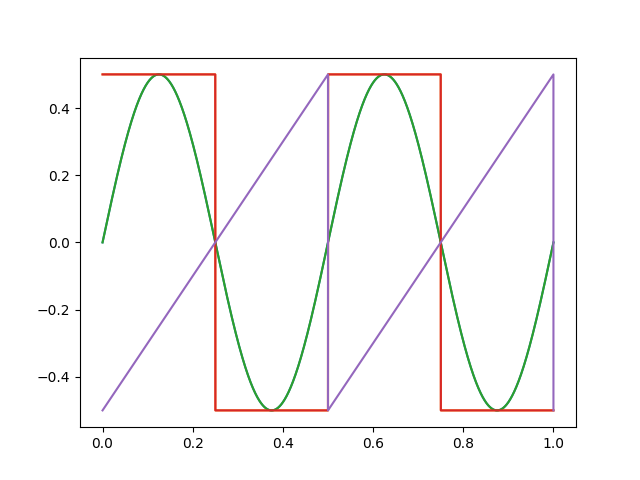
This class lets you create signals with the basic waveforms, sine, square and sawtooth, and of course noise.
Before building another pipeline, let#s get familiar with the signal generator and plot some signals.

from matplotlib import pyplot as plt
def example6():
    aSignalGenerator = pipeline.SignalGenerator()
    duration = 1.0
    frequency = 2
    amplitude = 0.5
    theta = 0.0
    sampleRate = 24414
    time, signal = aSignalGenerator.makeSineWave(duration,frequency,amplitude, theta, sampleRate)
    plt.plot(time, signal)
    time, signal = aSignalGenerator.makeSquareWave(duration,frequency,amplitude, theta, sampleRate)
    plt.plot(time, signal)
    time, signal = aSignalGenerator.makeSawtoothWave(duration,frequency,amplitude, theta, sampleRate)
    plt.plot(time, signal)
And this is what it looks like: