
Our first signal processing pipeline will take some data that we have generated using the SignalGenerator, plot the signal and get rid of it using a Datasink.
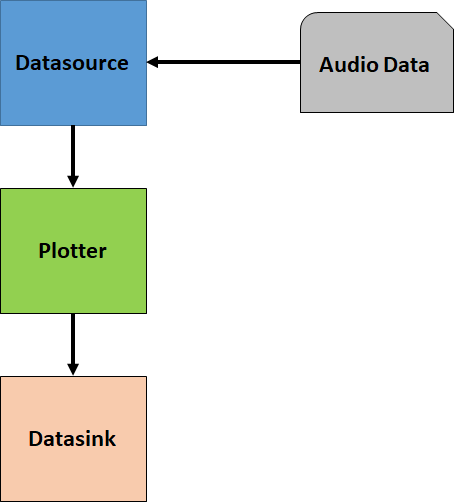
plots it and then gets rid of it.
To make our first signal processing pipeline, we first need to write a signal plotter plugin. Like our previous DataVisualizationPlugin it takes the data and plots it. The only differences are the type of data being processed and that we are using Matplotlib to plot the data. It is not going to be an award-winning component, but it will get the job done.
Let's have a look first at the code we have already written:
class DataVisualizationPlugin(pipeline.Plugin):
    def __init__(self):
        super().__init__()

    def process(self):
        super().process()
        randomData = super().getDataframe().getData()
        print("The data value is: ",randomData)
It appears as if this is already almost what we need. So let's make the small necessary changes.
First of all, we are working with audio data, so let's rename randomData to signal. And second of all let's call it SignalVisualizationPlugin.
Furthermore, we need to import Matplotilib and replace the line with the print() statement with plt.plot(time, signal).
To store the time and signal information in the Dataframe we also need a way to store this data in a single object. For that, we are using a list and append both time and signal information to it. Easy!
Let's write the SignalVisualizationPlugin
class SignalVisualizationPlugin(pipeline.Plugin):
    def __init__(self):
        super().__init__()

    def process(self):
        super().process()
        signalData = super().getDataframe().getData()
        time = signalData[0]
        signal = signalData[1]
        plt.plot(time, signal)
        plt.pause(0.001)
        plt.clf()
Note that, plt.plot(time, signal), plt.pause(0.001) and plt.clf() are just technicalities to clear and update our plot every time new data has arrived.
We are almost done. Let's assemble the pipeline and run it!
def example7():
aSignalGenerator = pipeline.SignalGenerator()
duration = 1.0
frequency = 0.1
amplitude = 0.5
theta = 0.0
sampleRate = 24414
aDatasource = pipeline.Datasource()
aDatasource.setName("Our Signal Datasource")
aSignalVisualizationPlugin = SignalVisualizationPlugin()
aSignalVisualizationPlugin.setName("Our Signal SignalVisualizationPlugin")
aDatasink = pipeline.Datasink()
aDatasink.setName("Our Signal Datasink")
aDatasource.setOutput(aSignalVisualizationPlugin)
aSignalVisualizationPlugin.setOutput(aDatasink)
while True:
for n in range(100):
#the audioData list stores the time and signal information
signalData = []
#we are multilying the frequency witn n to generate different looking signals
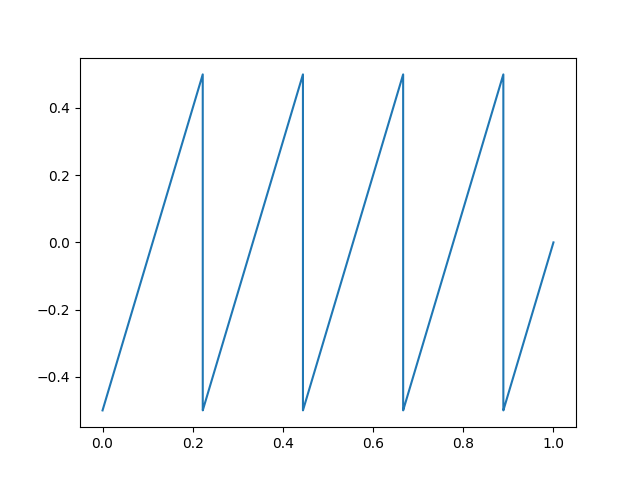
time, signal = aSignalGenerator.makeSawtoothWave(duration,frequency*n,amplitude, theta, sampleRate)
signalData.append(time)
signalData.append(signal)
aDataframe = pipeline.Dataframe()
aDataframe.setFrameNumber(n)
aDataframe.setData(signalData)
aDatasource.addDataframe(aDataframe)
aDatasource.run()