

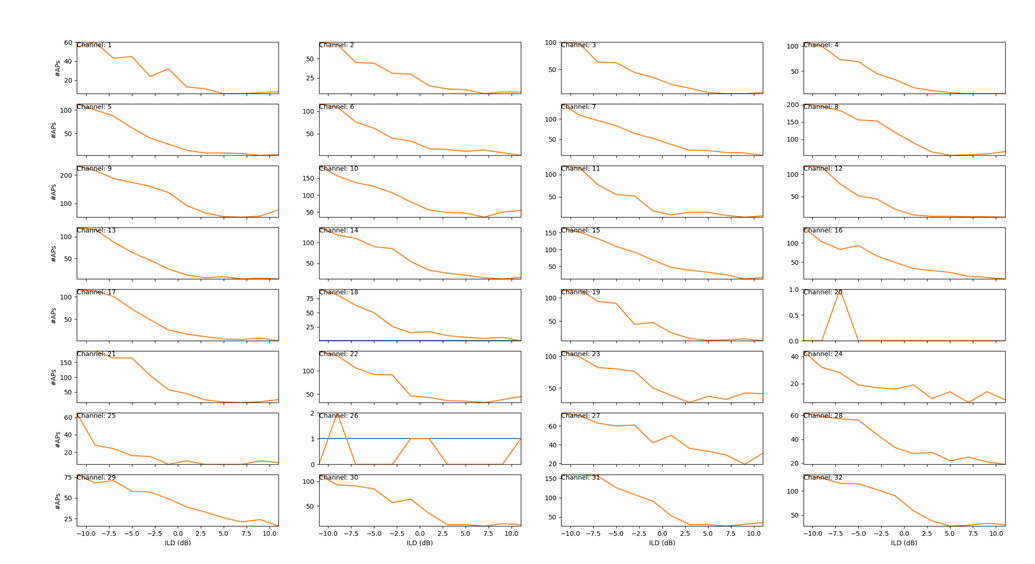
The y-axis shows the number of detected action potentials and on the x-axis the ILD (dB) value used during the stimulation.
Our goal for this example is to replicate the stimulation response plot shown in Fig 29.
To make this happen we will keep on extending our current pipeline. For plotting the responses to a stimulus, we will introduce a third pipeline branch and two more plugins -- the STIM_SpikeResponsesPlugin and the STIM_SpikeResponsesPlotterPlugin. Furthermore, we will only detect the spikes within a specific time window after the end of the stimulation and blanking. Last but not least, it should be obvious, that we will need to import real data since randomly generated spike data will yield a random result.
Although we are going to use familiar concepts, this is by far the most complex example of this tutorial. And therefore, we are doing this again step by step.
STIM_SpikeResponsesPlugin
The sole purpose of the STIM_SpikeResponsesPlugin is to prepare the spike responses to be easily plotted by the STIM_SpikeResponsesPlotterPlugin. It is important to know that the plugin does not check if the data has been produced regarding the specified stimulation parameter -- ABL, ILD, or ITD. The plugin assumes that you know what you are doing!
    stimResponsePlugin = pipeline.STIM_SpikeResponsesPlugin(range_min, range_max, stepSize)
    stimResponsePlugin.setName("Eyphs ResponsePlugin")
    stimResponsePlugin.setStimParameter(stimParameter)
The range_min, range_max, stepSize parameter specifies the minimum, maximum value of the stimulation parameters and the step size.
E.g. let's say you want to stimulate w.r.t ILD values ranging from -10 + 10 dB and you want a stepSize of 2.5 dB, then you would initialize the STIM_SpikeResponsesPlugin like this:
stimResponsePlugin = pipeline.STIM_SpikeResponsesPlugin(range_min = -10, range_max = 10, stepSize = 2.5)
stimResponsePlugin.setName("Eyphs ResponsePlugin")
stimResponsePlugin.setStimParameter(stimParameter = 'ILD (dB)')
STIM_SpikeResponsesPlotterPlugin
The STIM_SpikeResponsesPlotterPlugin takes the data prepared by the STIM_SpikeResponsesPlugin and plots it and is used to produce plots as shown in Fig 29.
The dimensions of the plot are set by width, height, rows, and cols. The labels for the x and y-axis are set by xlabel and ylabel. The plugin assumes that you know what you are doing and does not check!
updateYLimitsEvery is a necessity because otherwise, Matplotlib will not update the values on the y-axis.
stimParameter should be set to the same value as for the corresponding STIM_SpikeResponsesPlugin
And the xLimits should correspond to the data that is being plotted.
    aSTIM_SpikeResponsesPlotterPlugin = pipeline.STIM_SpikeResponsesPlotterPlugin(width=width, height=height, rows=rows , cols=cols, xlabel = xlabel, ylabel=ylabel, plotHandle=plt)
    aSTIM_SpikeResponsesPlotterPlugin.setName("Eyphs STIM_SpikeResponsesPlotterPlugin")
    aSTIM_SpikeResponsesPlotterPlugin.setStimParameter(stimParameter)
    aSTIM_SpikeResponsesPlotterPlugin.setUpdateEveryFrames(updateYLimitsEvery)
    aSTIM_SpikeResponsesPlotterPlugin.setXlimits(xMin,xMax)
Before we set up the pipeline we need to initialize a few parameters.
    stimulatorModule.soundPlayer=None
    stim=stimulatorModule.clickTrainObject()
    stimObjectCopy = None
    enableBlanking = True
    blankingEndOffsetInSeconds = 0.000
    spikeDetectionWindowStartInSeconds = 0.003
    spikeDetectionWindowEndInSeconds = 0.100
    fs = 24414 # this is the samplerate of the TDT system
    stim.ready()
Here, we initialize the stimulation parameter object that we will need to fill with the correct parameters from the actual data that we are going to use. As before we will work with copies of this object and of course we will blank the signal. The two new parameters that we have not used before defining the position and the length of the detection window. Later we will offset those values using the duration of the stimulation. As before, stim.ready() initialized the parameter object before we are going to use it.
Next, we need to set the parameters regarding the plotting:
    #configure the stim parameter and set the axis labels
    stimParameter = 'ILD (dB)'
    xlabel = "ILD (dB)"
    ylabel ="#APs"

    # Here, we provide the range limits and the step size
    # range_min = 0
    # range_max = 20
    # stepSize = 5
    # Will result in ranges 0,5,10,15,20
    #
    range_min = -11 #minimum ILD value
    range_max = 11 #maximum ILD value
    stepSize = 2 #ILD stepsize
    rangeValues = np.arange(range_min,range_max+stepSize, stepSize)
    rangeValues = [round(num, 2) for num in rangeValues]

    #set the x limits for the plots
    xMin = range_min
    xMax = range_max

    #this sets the dimensions of the response plot window.
    width=20
    height=6
    rows=8
    cols=4
    updateYLimitsEvery=10 # sweeps
The new pipeline code using three branches instead of two looks like this:
    ephysPipeline = pipeline.Datasource()
    ephysPipeline.setName("Eyphs PushDataSource")
    anSweepSpikeFilterPlugin = pipeline.SweepSpikeFiltFiltPlugin()
    anSweepSpikeFilterPlugin.setName("Eyphs SweepSpikeFilterPlugin")

    aSweepInterBlankingPlugin = pipeline.SweepInterBlankingPlugin()
    aSweepInterBlankingPlugin.setName("Eyphs SweepInterBlankingPlugin")
    aSweepInterBlankingPlugin.setEnabled(enableBlanking)
    aSweepInterBlankingPlugin.setEndOffsetInSeconds(blankingEndOffsetInSeconds)

    aSpikeDetector = pipeline.SpikeDetector()
    aSpikeDetector.setName("Eyphs SpikeDetector")
    aSpikeDetector.setStimEndOffsetInSeconds(blankingEndOffsetInSeconds)
    stimResponsePlugin = pipeline.STIM_SpikeResponsesPlugin(range_min, range_max, stepSize)
    stimResponsePlugin.setName("Eyphs ResponsePlugin")
    stimResponsePlugin.setStimParameter(stimParameter)

    aSTIM_SpikeResponsesPlotterPlugin = pipeline.STIM_SpikeResponsesPlotterPlugin(width=width, height=height, rows=rows , cols=cols, xlabel = xlabel, ylabel=ylabel, plotHandle=plt)
    aSTIM_SpikeResponsesPlotterPlugin.setName("Eyphs STIM_SpikeResponsesPlotterPlugin")
    aSTIM_SpikeResponsesPlotterPlugin.setStimParameter(stimParameter)
    aSTIM_SpikeResponsesPlotterPlugin.setUpdateEveryFrames(updateYLimitsEvery)
    aSTIM_SpikeResponsesPlotterPlugin.setXlimits(xMin,xMax)

    aNSweepsBufferPlugin = pipeline.NSweepsBufferPlugin()
    aNSweepsBufferPlugin.setName("Eyphs aNSweepsBufferPlugin")
    aNSweepsRasterPlotPlugin = pipeline.NSweepsRasterPlotPlugin()
    aNSweepsRasterPlotPlugin.setName("Ephys aNSweepsRasterPlotPlugin")

    a100SweepBufferPlugin = pipeline.NSweepsBufferPlugin(numSweeps=100)
    a100SweepBufferPlugin.setName("Eyphs a100SweepsBufferPlugin")

    aDisplay = pipeline.MplSweepDataDisplay(plt)
    aDisplay.setName("Eyphs DataDisplay")
    aDatasink = pipeline.Datasink()
    aDatasink.setName("Eyphs DataSink")

    aCloneDatasource = pipeline.CloneDatasource(3)
    aCloneDatasource.setName("aCloneDatasource")
    aDatasink0 = pipeline.Datasink()
    aDatasink0.setName("Eyphs DataSink")

    aDatasink1 = pipeline.Datasink()
    aDatasink1.setName("Eyphs DataSink")

    aDatasink2 = pipeline.Datasink()
    aDatasink2.setName("Eyphs DataSink")

    ephysPipeline.setOutput(aSweepInterBlankingPlugin)
    aSweepInterBlankingPlugin.setOutput(anSweepSpikeFilterPlugin)
    anSweepSpikeFilterPlugin.setOutput(aSpikeDetector)
    aSpikeDetector.setOutput(aCloneDatasource)

    aCloneDatasource.setOutput(stimResponsePlugin,0)
    aCloneDatasource.setOutput(a100SweepBufferPlugin,1)
    aCloneDatasource.setOutput(aNSweepsBufferPlugin,2)

    aSingleChannelRasterPlotPlugin = pipeline.NSweepsRasterPlotPlugin(singleChannelPlot = True)
    aSingleChannelRasterPlotPlugin.setName("Ephys aSingleChannelRasterPlotPlugin")

    a100SweepBufferPlugin.setOutput(aSingleChannelRasterPlotPlugin)
    aSingleChannelRasterPlotPlugin.setOutput(aDatasink1)

    stimResponsePlugin.setOutput(aSTIM_SpikeResponsesPlotterPlugin)
    aSTIM_SpikeResponsesPlotterPlugin.setOutput(aDatasink0)

    a100SweepBufferPlugin.setOutput(aSingleChannelRasterPlotPlugin)
    aSingleChannelRasterPlotPlugin.setOutput(aDatasink1)

    aNSweepsBufferPlugin.setOutput(aNSweepsRasterPlotPlugin)
    aNSweepsRasterPlotPlugin.setOutput(aDisplay)
    aDisplay.setOutput(aDatasink0)
It is again longer but only marginally more complex than the "Ephys Search pipeline" we have developed in the previous example.
The reason for having three branches is to be able to see raster plots for the entire spike times data instead of only showing the data within the detection window.
aCloneDatasource.setOutput(stimResponsePlugin,0)
aCloneDatasource.setOutput(a100SweepBufferPlugin,1)
aCloneDatasource.setOutput(aNSweepsBufferPlugin,2)
Since the stimResponsePlugin alters the content of the spike times within the spike times buffer, we need to branch the data three instead of two times. Only showing the raster plot of the data within the detection window would not affect the outcome of the STIM_SpikeResponsesPlotterPlugin. If you compare the structure of this pipeline with the one presented in Fig4, you will notice that this is a slightly updated version of this pipeline. Congratulations! You have just recreated the pipeline used in the ABLThresholding program, the ITD and ILD tuning program, and the GRF2018Acute ephys program!
The actual data we are going to process with our pipeline is CI1733\data\P4_ILDfineG_RZ2-1_*.bwvt which can be found on Twinke at /home/colliculus/ephys/3/CIacuteExperiments/ CI1733\data\P4_ILDfineG_RZ2-1_*.bwvt
and in Freiburg at:
"'Q:\HNO-T-NeuroBio-EP-Daten\HK_CI_Acute_Experiments\CI1733\data\P4_ILDfineG_RZ2-1_*.bwvt'"
For importing this data you need the Python Brainware importer located in the subfolder py_Brainware_Import.
Note that PyTorch is needed for the importer which might be hard or impossible to install on certain Windows 10 installations. Fortunately, you can still check out the same pipeline by running the ABLThresholding program, the ITD and ILD tuning program, and the GRF2018Acute ephys program. All EpyhsPrograms let you run in a simulation mode, so you don't need to have access to the TDT system. However, with random data you will also get random spike responses.
If you are lucky to get PyTorch to install, these the first of this three lines will load the data and the second and third will get you the number of channels and the number of trials/sweeps.
 aBWdataObject = BrainWare.BrainwareDataObj('Q:\HNO-T-NeuroBio-EP-Daten\HK_CI_Acute_Experiments\CI1733\data\P4_ILDfineG_RZ2-1_*.bwvt')
 numChannels = len(aBWdataObject.dataobj)
 numTrials = len(aBWdataObject.dataobj[0].stimindex)
Creating and filling the MCsweep object with the Brainware Data is very similar to what we have done with the data we have generated with the signal generator way back in example8
    for trialIdx in range(numTrials):
        stimObjectCopy = copy.deepcopy(stim)
        durationParamIndex = aBWdataObject.analogzip[0]['stim']['paramName'].index('Duration (ms)')
        ildParamIndex = aBWdataObject.analogzip[0]['stim']['paramName'].index('ILD (dB 100uA)')
        #assuming they are all the same length
        lenOfTrialSignal = len(aBWdataObject.dataobj[0].signal[0])
        stimObjectCopy.stimParams['duration (s)'] = aBWdataObject.analogzip[trialIdx]['stim']['paramVal'][durationParamIndex]/1000
        stimObjectCopy.stimParams['ILD (dB)'] = aBWdataObject.analogzip[trialIdx]['stim']['paramVal'][ildParamIndex]
        print("stimObjectCopy.stimParams['ILD (dB)'] ", stimObjectCopy.stimParams['ILD (dB)'])
        spikeDetectionWindowStart_s = stimObjectCopy.stimParams['duration (s)']+blankingEndOffsetInSeconds+spikeDetectionWindowStartInSeconds
        stimResponsePlugin.setSpiketimesDetectionWindow(spikeDetectionWindowStart_s, spikeDetectionWindowStart_s+spikeDetectionWindowEndInSeconds)
        #make sweep object.
        sigChunk=np.zeros(lenOfTrialSignal*numChannels)
        sigTupel = tuple(sigChunk)
        newSweep=RZ2ephys.MCsweep(sigTupel,lenOfTrialSignal,fs,0)
        #add data to all channels
        for chanIdx in range(numChannels):
            newSweep.signal[:,chanIdx] = copy.deepcopy(aBWdataObject.dataobj[chanIdx].signal[trialIdx]/1000.0)
        print("trialIdx ", trialIdx)
        aDataframe = pipeline.Dataframe()
        aDataframe.setData(newSweep)
        aDataframe.setStimObject(stimObjectCopy)
        ephysPipeline.addDataframe(aDataframe)
        ephysPipeline.run()
The only significant addition is that we copy the stimulation parameters from the Brainware file and process the data with a more complex pipeline.
The complete code looks like this:
import os
import py_Brainware_Import.py_Brainware_Import.method.brainware as BrainWare
import ClickTrainLibrary as stimulatorModule
def example19():
    stimulatorModule.soundPlayer=None
    stim=stimulatorModule.clickTrainObject()
    stimObjectCopy = None
    enableBlanking = True
    blankingEndOffsetInSeconds = 0.000
    spikeDetectionWindowStartInSeconds = 0.003
    spikeDetectionWindowEndInSeconds = 0.100
    fs = 24414 # this is the samplerate of the TDT system
    stim.ready()

    #configure the stim parameter and set the axis labels
    stimParameter = 'ILD (dB)'
    xlabel = "ILD (dB)"
    ylabel ="#APs"

    # Here, we provide the range limits and the step size
    # range_min = 0
    # range_max = 20
    # stepSize = 5
    # Will result in ranges 0,5,10,15,20
    #
    range_min = -11 #minimum ILD value
    range_max = 11 #maximum ILD value
    stepSize = 2 #ILD stepsize
    rangeValues = np.arange(range_min,range_max+stepSize, stepSize)
    rangeValues = [round(num, 2) for num in rangeValues]

    #set the x limits for the plots
    xMin = range_min
    xMax = range_max

    #this sets the dimensions of the response plot window.
    width=20
    height=6
    rows=8
    cols=4
    updateYLimitsEvery=10 # sweeps

    ephysPipeline = pipeline.Datasource()
    ephysPipeline.setName("Eyphs PushDataSource")
    anSweepSpikeFilterPlugin = pipeline.SweepSpikeFiltFiltPlugin()
    anSweepSpikeFilterPlugin.setName("Eyphs SweepSpikeFilterPlugin")

    aSweepInterBlankingPlugin = pipeline.SweepInterBlankingPlugin()
    aSweepInterBlankingPlugin.setName("Eyphs SweepInterBlankingPlugin")
    aSweepInterBlankingPlugin.setEnabled(enableBlanking)
    aSweepInterBlankingPlugin.setEndOffsetInSeconds(blankingEndOffsetInSeconds)

    aSpikeDetector = pipeline.SpikeDetector()
    aSpikeDetector.setName("Eyphs SpikeDetector")
    aSpikeDetector.setStimEndOffsetInSeconds(blankingEndOffsetInSeconds)
    stimResponsePlugin = pipeline.STIM_SpikeResponsesPlugin(range_min, range_max, stepSize)
    stimResponsePlugin.setName("Eyphs ResponsePlugin")
    stimResponsePlugin.setStimParameter(stimParameter)

    aSTIM_SpikeResponsesPlotterPlugin = pipeline.STIM_SpikeResponsesPlotterPlugin(width=width, height=height, rows=rows , cols=cols, xlabel = xlabel, ylabel=ylabel, plotHandle=plt)
    aSTIM_SpikeResponsesPlotterPlugin.setName("Eyphs STIM_SpikeResponsesPlotterPlugin")
    aSTIM_SpikeResponsesPlotterPlugin.setStimParameter(stimParameter)
    aSTIM_SpikeResponsesPlotterPlugin.setUpdateEveryFrames(updateYLimitsEvery)
    aSTIM_SpikeResponsesPlotterPlugin.setXlimits(xMin,xMax)

    aNSweepsBufferPlugin = pipeline.NSweepsBufferPlugin()
    aNSweepsBufferPlugin.setName("Eyphs aNSweepsBufferPlugin")
    aNSweepsRasterPlotPlugin = pipeline.NSweepsRasterPlotPlugin()
    aNSweepsRasterPlotPlugin.setName("Ephys aNSweepsRasterPlotPlugin")

    a100SweepBufferPlugin = pipeline.NSweepsBufferPlugin(numSweeps=100)
    a100SweepBufferPlugin.setName("Eyphs a100SweepsBufferPlugin")

    aDisplay = pipeline.MplSweepDataDisplay(plt)
    aDisplay.setName("Eyphs DataDisplay")
    aDatasink = pipeline.Datasink()
    aDatasink.setName("Eyphs DataSink")

    aCloneDatasource = pipeline.CloneDatasource(3)
    aCloneDatasource.setName("aCloneDatasource")
    aDatasink0 = pipeline.Datasink()
    aDatasink0.setName("Eyphs DataSink")

    aDatasink1 = pipeline.Datasink()
    aDatasink1.setName("Eyphs DataSink")

    aDatasink2 = pipeline.Datasink()
    aDatasink2.setName("Eyphs DataSink")

    ephysPipeline.setOutput(aSweepInterBlankingPlugin)
    aSweepInterBlankingPlugin.setOutput(anSweepSpikeFilterPlugin)
    anSweepSpikeFilterPlugin.setOutput(aSpikeDetector)
    aSpikeDetector.setOutput(aCloneDatasource)

    aCloneDatasource.setOutput(stimResponsePlugin,0)
    aCloneDatasource.setOutput(a100SweepBufferPlugin,1)
    aCloneDatasource.setOutput(aNSweepsBufferPlugin,2)

    aSingleChannelRasterPlotPlugin = pipeline.NSweepsRasterPlotPlugin(singleChannelPlot = True)
    aSingleChannelRasterPlotPlugin.setName("Ephys aSingleChannelRasterPlotPlugin")

    a100SweepBufferPlugin.setOutput(aSingleChannelRasterPlotPlugin)
    aSingleChannelRasterPlotPlugin.setOutput(aDatasink1)

    stimResponsePlugin.setOutput(aSTIM_SpikeResponsesPlotterPlugin)
    aSTIM_SpikeResponsesPlotterPlugin.setOutput(aDatasink0)

    a100SweepBufferPlugin.setOutput(aSingleChannelRasterPlotPlugin)
    aSingleChannelRasterPlotPlugin.setOutput(aDatasink1)

    aNSweepsBufferPlugin.setOutput(aNSweepsRasterPlotPlugin)
    aNSweepsRasterPlotPlugin.setOutput(aDisplay)
    aDisplay.setOutput(aDatasink0)

    #load brainware
    aBWdataObject = BrainWare.BrainwareDataObj('Q:\HNO-T-NeuroBio-EP-Daten\HK_CI_Acute_Experiments\CI1733\data\P4_ILDfineG_RZ2-1_*.bwvt')

    numChannels = len(aBWdataObject.dataobj)
    numTrials = len(aBWdataObject.dataobj[0].stimindex)

    for trialIdx in range(numTrials):
        stimObjectCopy = copy.deepcopy(stim)
        durationParamIndex = aBWdataObject.analogzip[0]['stim']['paramName'].index('Duration (ms)')
        ildParamIndex = aBWdataObject.analogzip[0]['stim']['paramName'].index('ILD (dB 100uA)')
        #assuming they are all the same length
        lenOfTrialSignal = len(aBWdataObject.dataobj[0].signal[0])
        stimObjectCopy.stimParams['duration (s)'] = aBWdataObject.analogzip[trialIdx]['stim']['paramVal'][durationParamIndex]/1000
        stimObjectCopy.stimParams['ILD (dB)'] = aBWdataObject.analogzip[trialIdx]['stim']['paramVal'][ildParamIndex]
        print("stimObjectCopy.stimParams['ILD (dB)'] ", stimObjectCopy.stimParams['ILD (dB)'])
        spikeDetectionWindowStart_s = stimObjectCopy.stimParams['duration (s)']+blankingEndOffsetInSeconds+spikeDetectionWindowStartInSeconds
        stimResponsePlugin.setSpiketimesDetectionWindow(spikeDetectionWindowStart_s, spikeDetectionWindowStart_s+spikeDetectionWindowEndInSeconds)
        #make sweep object.
        sigChunk=np.zeros(lenOfTrialSignal*numChannels)
        sigTupel = tuple(sigChunk)
        newSweep=RZ2ephys.MCsweep(sigTupel,lenOfTrialSignal,fs,0)
        #add data to all channels
        for chanIdx in range(numChannels):
            newSweep.signal[:,chanIdx] = copy.deepcopy(aBWdataObject.dataobj[chanIdx].signal[trialIdx]/1000.0)
        print("trialIdx ", trialIdx)
        aDataframe = pipeline.Dataframe()
        aDataframe.setData(newSweep)
        aDataframe.setStimObject(stimObjectCopy)
        ephysPipeline.addDataframe(aDataframe)
        ephysPipeline.run()
And the output looks like this:
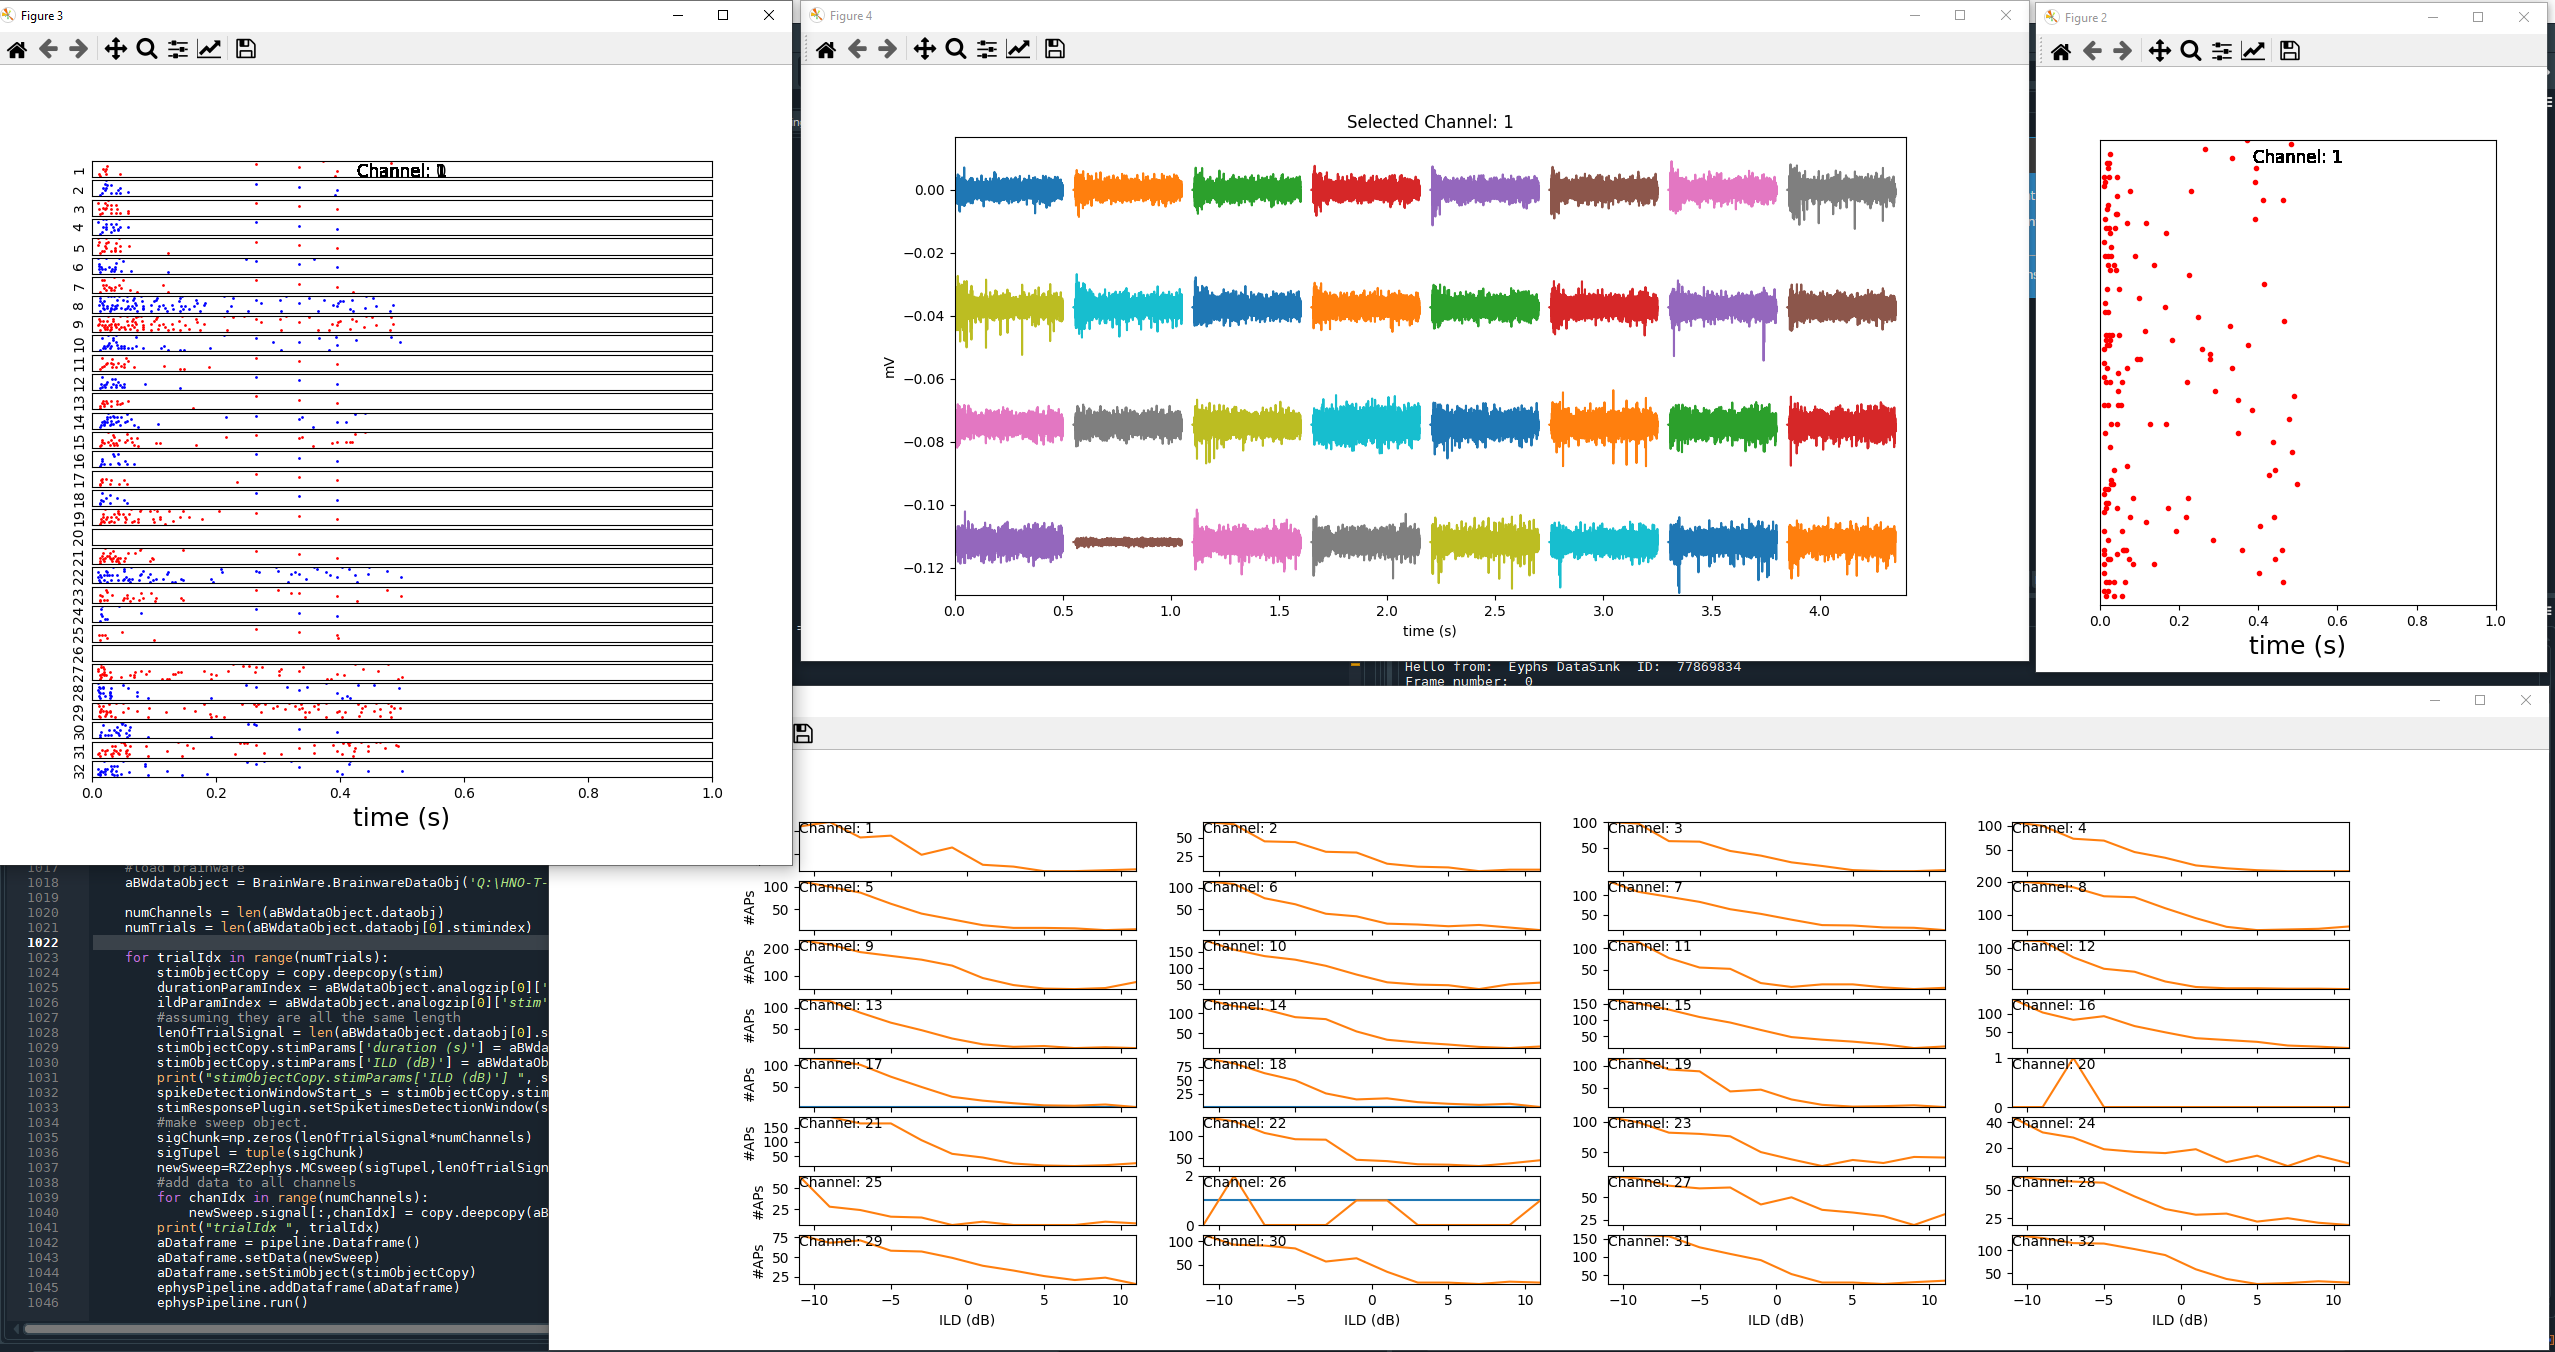
From completeness, here is the source code of example20()
It is almost identical to example19() but imports IDT instead of ILD data. The Brainware data used in this example is also available on Twinkle at /home/colliculus/ephys/3/CIacuteExperiments/ CI1733\data
and in Freiburg at
"Q:\HNO-T-NeuroBio-EP-Daten\HK_CI_Acute_Experiments\CI1733\data\"
def example20():
stimulatorModule.soundPlayer=None
stim=stimulatorModule.clickTrainObject()
stimObjectCopy = None
enableBlanking = True
blankingEndOffsetInSeconds = 0.003
spikeDetectionWindowStartInSeconds = 0.003
spikeDetectionWindowEndInSeconds = 0.100
fs = 24414 # this is the samplerate of the TDT system
stim.ready()
#configure the stim parameter and set the axis labels
stimParameter = 'ITD (ms)'
xlabel = "ITD (ms)"
ylabel ="#APs"
# Here, we provide the range limits and the step size
# range_min = -0.14
# range_max = 0.14
# stepSize = 0.02
# Will result in ranges -0.14, -0.12, -0.1, -0.08, -0.06, -0.04, -0.02, -0.0, 0.02, 0.04, 0.06, 0.08 ,0.1, 0.12, 0.14
#
range_min = -0.16 #minimum ITD value
range_max = 0.16 #maximum ITD value
stepSize = 0.02 #ITD stepsize
rangeValues = np.arange(range_min,range_max+stepSize, stepSize)
rangeValues = [round(num, 2) for num in rangeValues]
#set the x limits for the plots
xMin = range_min
xMax = range_max
#this controls the dimensions of the response plot window.
width=20
height=6
rows=8
cols=4
updateYLimitsEvery=10 # sweeps
ephysPipeline = Datasource()
ephysPipeline.setName("Eyphs PushDataSource")
anSweepSpikeFilterPlugin = SweepSpikeFiltFiltPlugin()
anSweepSpikeFilterPlugin.setName("Eyphs SweepSpikeFilterPlugin")
aSweepInterBlankingPlugin = SweepInterBlankingPlugin()
aSweepInterBlankingPlugin.setName("Eyphs SweepInterBlankingPlugin")
aSweepInterBlankingPlugin.setEnabled(enableBlanking)
aSweepInterBlankingPlugin.setEndOffsetInSeconds(blankingEndOffsetInSeconds)
aSpikeDetector = SpikeDetector()
aSpikeDetector.setName("Eyphs SpikeDetector")
aSpikeDetector.setStimEndOffsetInSeconds(blankingEndOffsetInSeconds)
stimResponsePlugin = STIM_SpikeResponsesPlugin(range_min, range_max, stepSize)
stimResponsePlugin.setName("Eyphs ResponsePlugin")
stimResponsePlugin.setStimParameter(stimParameter)
aSTIM_SpikeResponsesPlotterPlugin = STIM_SpikeResponsesPlotterPlugin(width=width, height=height, rows=rows , cols=cols, xlabel = xlabel, ylabel=ylabel, plotHandle=plt)
aSTIM_SpikeResponsesPlotterPlugin.setName("Eyphs STIM_SpikeResponsesPlotterPlugin")
aSTIM_SpikeResponsesPlotterPlugin.setStimParameter(stimParameter)
aSTIM_SpikeResponsesPlotterPlugin.setUpdateEveryFrames(updateYLimitsEvery)
aSTIM_SpikeResponsesPlotterPlugin.setXlimits(xMin,xMax)
aNSweepsBufferPlugin = NSweepsBufferPlugin()
aNSweepsBufferPlugin.setName("Eyphs aNSweepsBufferPlugin")
aNSweepsRasterPlotPlugin = NSweepsRasterPlotPlugin()
aNSweepsRasterPlotPlugin.setName("Ephys aNSweepsRasterPlotPlugin")
a100SweepBufferPlugin = NSweepsBufferPlugin(numSweeps=100)
a100SweepBufferPlugin.setName("Eyphs a100SweepsBufferPlugin")
aDisplay = MplSweepDataDisplay(plt)
aDisplay.setName("Eyphs DataDisplay")
aDatasink = Datasink()
aDatasink.setName("Eyphs DataSink")
aCloneDatasource = CloneDatasource(3)
aCloneDatasource.setName("aCloneDatasource")
aDatasink0 = Datasink()
aDatasink0.setName("Eyphs DataSink")
aDatasink1 = Datasink()
aDatasink1.setName("Eyphs DataSink")
aDatasink2 = Datasink()
aDatasink2.setName("Eyphs DataSink")
ephysPipeline.setOutput(aSweepInterBlankingPlugin)
aSweepInterBlankingPlugin.setOutput(anSweepSpikeFilterPlugin)
anSweepSpikeFilterPlugin.setOutput(aSpikeDetector)
aSpikeDetector.setOutput(aCloneDatasource)
aCloneDatasource.setOutput(stimResponsePlugin,0)
aCloneDatasource.setOutput(a100SweepBufferPlugin,1)
aCloneDatasource.setOutput(aNSweepsBufferPlugin,2)
aSingleChannelRasterPlotPlugin = NSweepsRasterPlotPlugin(singleChannelPlot = True)
aSingleChannelRasterPlotPlugin.setName("Ephys aSingleChannelRasterPlotPlugin")
a100SweepBufferPlugin.setOutput(aSingleChannelRasterPlotPlugin)
aSingleChannelRasterPlotPlugin.setOutput(aDatasink1)
stimResponsePlugin.setOutput(aSTIM_SpikeResponsesPlotterPlugin)
aSTIM_SpikeResponsesPlotterPlugin.setOutput(aDatasink0)
a100SweepBufferPlugin.setOutput(aSingleChannelRasterPlotPlugin)
aSingleChannelRasterPlotPlugin.setOutput(aDatasink1)
aNSweepsBufferPlugin.setOutput(aNSweepsRasterPlotPlugin)
aNSweepsRasterPlotPlugin.setOutput(aDisplay)
aDisplay.setOutput(aDatasink0)
#load brainware
aBWdataObject = BrainWare.BrainwareDataObj('Q:\HNO-T-NeuroBio-EP-Daten\HK_CI_Acute_Experiments\CI1733\data\P3_L_ITDfineG_RZ2-1_*.bwvt')
numChannels = len(aBWdataObject.dataobj)
numTrials = len(aBWdataObject.dataobj[0].stimindex)
for trialIdx in range(numTrials):
stimObjectCopy = copy.deepcopy(stim)
durationParamIndex = aBWdataObject.analogzip[0]['stim']['paramName'].index('Duration (ms)')
itdParamIndex = aBWdataObject.analogzip[0]['stim']['paramName'].index('ITD (uS)')
#assuming they are all the same length
lenOfTrialSignal = len(aBWdataObject.dataobj[0].signal[0])
stimObjectCopy.stimParams['duration (s)'] = aBWdataObject.analogzip[trialIdx]['stim']['paramVal'][durationParamIndex]/1000
stimObjectCopy.stimParams['ITD (ms)'] = aBWdataObject.analogzip[trialIdx]['stim']['paramVal'][itdParamIndex]/1000
spikeDetectionWindowStart_s = stimObjectCopy.stimParams['duration (s)']+blankingEndOffsetInSeconds+spikeDetectionWindowStartInSeconds
stimResponsePlugin.setSpiketimesDetectionWindow(spikeDetectionWindowStart_s, spikeDetectionWindowStart_s+spikeDetectionWindowEndInSeconds)
#make sweep object.
sigChunk=np.zeros(lenOfTrialSignal*numChannels)
sigTupel = tuple(sigChunk)
newSweep=RZ2ephys.MCsweep(sigTupel,lenOfTrialSignal,fs,0)
#add data to all channels
for chanIdx in range(numChannels):
newSweep.signal[:,chanIdx] = copy.deepcopy(aBWdataObject.dataobj[chanIdx].signal[trialIdx]/1000.0)
print("trialIdx ", trialIdx)
aDataframe = Dataframe()
aDataframe.setData(newSweep)
aDataframe.setStimObject(stimObjectCopy)
ephysPipeline.addDataframe(aDataframe)
ephysPipeline.run()